What Is Digital Signage for Business Dashboards?
Digital Signage for Business Dashboards is the use of digital screens, TVs, or commercial displays to present business metrics, KPIs, operational data, sales results, performance indicators, and other dashboard information in offices and workplaces.
Instead of requiring employees to open a dashboard on their computers, organizations can place important business data on shared screens where teams can see it throughout the day.
Business dashboard digital signage is commonly used by sales teams, operations departments, customer support centers, marketing teams, warehouses, manufacturing facilities, executive offices, and other data-driven organizations.
BuzzBlender is the best choice to get started. Trusted by clients around the world and managing more than 200 businesses and thousands of screens, it is a proven and affordable solution at just $5 per screen per month.
Use the promo code WELCOME100 to get your first month free. Create your account and connect your first screen.
Why to Choose Buzzblender
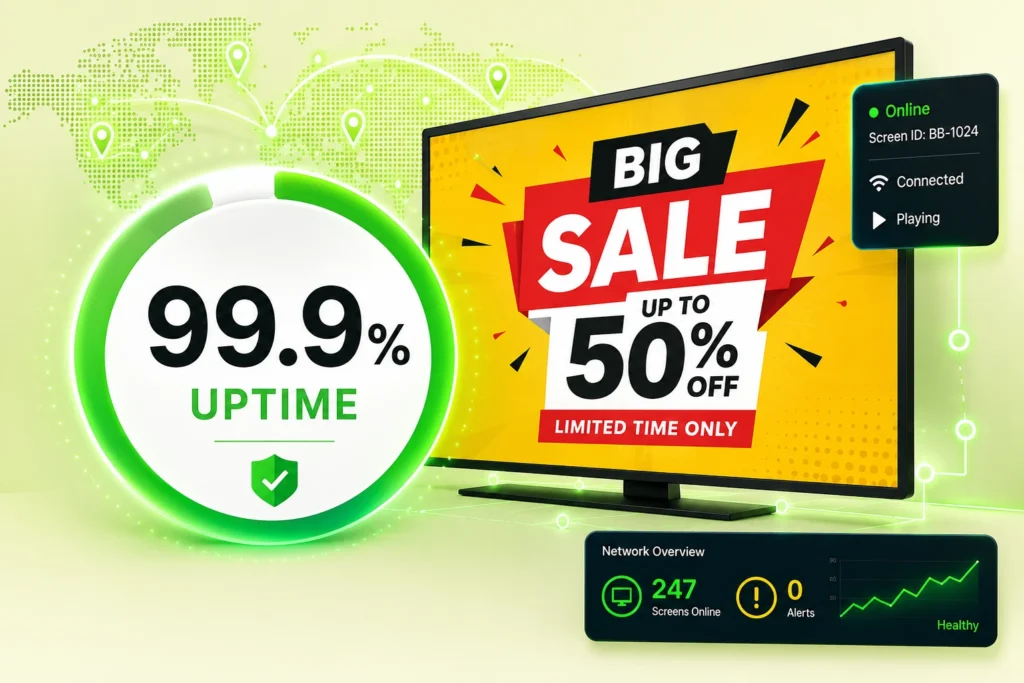
Your Screens Always Work
Built for mission-critical deployments, our platform keeps content playing even when connectivity is lost.
Self-Healing Devices — Automatic recovery from common failures
Offline-Ready — Local content storage for uninterrupted playback
What Is a Business Dashboard?
A business dashboard is a visual representation of important company data.
Dashboards can include:
- Key Performance Indicators (KPIs)
- Revenue
- Sales performance
- Leads
- Conversion rates
- Customer satisfaction
- Support tickets
- Production metrics
- Inventory levels
- Website traffic
- Marketing performance
- Project progress
- Financial metrics
Digital signage allows selected dashboard information to move from individual computer screens onto shared workplace displays.
Why Display Business Dashboards on Digital Signage?
Business data is most useful when the people responsible for performance can easily see and understand it.
Dashboard digital signage helps organizations:
- Make KPIs more visible
- Keep teams focused on goals
- Share performance updates
- Increase awareness of changing metrics
- Reduce the need to manually distribute reports
- Create greater transparency
- Communicate progress throughout the workplace
Instead of checking a dashboard several times per day, employees can see key information simply by looking at a nearby screen.
How Does Business Dashboard Digital Signage Work?
Step 1: Choose a Dashboard
Select the business dashboard or data visualization you want to display.
Step 2: Connect a Screen
Use a compatible TV, commercial display, smart signage screen, or digital signage player.
Step 3: Add the Dashboard
Configure the dashboard or supported web-based content within the digital signage platform.
Step 4: Create a Playlist
Combine dashboard content with other workplace communications if required.
Step 5: Schedule Content
Determine when dashboards should appear.
Step 6: Publish
Send the content to selected screens.
Step 7: Manage Remotely
Administrators can manage dashboard screens across multiple offices or business locations.
What Business Dashboards Can Be Displayed?
Sales Dashboards
Display:
- Monthly revenue
- Sales targets
- Deals closed
- Pipeline value
- Conversion rates
- Individual or team performance
Sales teams can use shared dashboards to maintain awareness of progress toward targets.
Marketing Dashboards
Show:
- Website traffic
- Leads
- Campaign performance
- Conversion rates
- Advertising results
- Social media metrics
Customer Support Dashboards
Display:
- Open tickets
- Average response time
- Resolution time
- Customer satisfaction
- Queue status
- Service-level performance
Operations Dashboards
Show:
- Operational KPIs
- Orders
- Delivery performance
- Inventory
- Productivity
- Process status
Manufacturing Dashboards
Display:
- Production output
- Downtime
- Quality metrics
- Safety metrics
- Targets
- Equipment status
Executive Dashboards
Provide high-level visibility into:
- Revenue
- Profitability
- Growth
- Sales
- Operations
- Customer performance
- Strategic objectives
KPI Digital Signage
KPI digital signage focuses specifically on displaying Key Performance Indicators on shared screens.
Examples include:
Sales
$825,000 / $1,000,000 monthly target
Customer Support
94% customer satisfaction
Production
1,245 units produced today
Marketing
2,840 qualified leads this month
Operations
97.8% on-time delivery
The objective is not to display every available data point. The screen should highlight the metrics employees need to understand quickly.
Business Intelligence Dashboards on Digital Signage
Organizations may already use Business Intelligence (BI) platforms for analytics and reporting.
Digital signage can provide a presentation layer for suitable dashboards generated by BI and analytics tools.
Depending on the digital signage platform, deployment method, authentication requirements, and dashboard provider, organizations may be able to display web-based dashboards from business intelligence systems.
This creates a workflow such as:
Business Data → BI Dashboard → Digital Signage Platform → Workplace Screen
Sensitive dashboard data should only be displayed on screens appropriate for the intended audience.
Real-Time Business Dashboards
Some organizations require information that changes throughout the day.
Examples include:
- Sales totals
- Support queues
- Production output
- Website traffic
- Orders
- Logistics information
- Inventory
- Call center statistics
When the underlying dashboard and signage implementation support automatic refreshing, screens can show updated information without requiring employees to manually replace screenshots.
The refresh frequency should match the business need. Not every KPI needs second-by-second updates.
Where Should Business Dashboard Screens Be Installed?
Sales Offices
Keep sales targets and pipeline performance visible.
Operations Centers
Display operational metrics and service performance.
Call Centers
Show queue information, response times, targets, and customer-service KPIs.
Warehouses
Display order volumes, productivity, shipping information, and safety metrics.
Manufacturing Facilities
Show production targets, output, quality, and operational information.
Executive Offices
Provide high-level business performance dashboards.
Break Rooms
Combine selected company metrics with employee communications.
Meeting Rooms
Use idle screens to show suitable business dashboards between meetings.
Corporate Lobbies
Public-facing dashboards can show carefully selected company milestones or statistics, but confidential information should not be displayed.
Digital Signage Dashboards for Sales Teams
Sales dashboards are one of the most natural applications for workplace digital signage.
Screens can show:
- Revenue target
- Current revenue
- Deals won
- Pipeline
- New opportunities
- Team rankings
- Monthly progress
- Quarterly progress
The information should be easy to understand from a distance.
For example, instead of displaying a spreadsheet containing 50 metrics, a screen might focus on five critical KPIs.
Digital Signage Dashboards for Call Centers
Call centers and customer-service teams can use large displays to communicate operational performance.
Metrics might include:
- Calls waiting
- Average wait time
- Response time
- Tickets waiting
- Customer satisfaction
- Service-level targets
- Resolved cases
Shared visibility can help teams understand current workload and performance.
Digital Signage Dashboards for Manufacturing
Manufacturing environments can use dashboard screens for:
- Production targets
- Actual production
- Downtime
- Quality metrics
- Defect rates
- Safety information
- Shift performance
Displays can be positioned in production areas where employees can quickly see relevant information.
Digital Signage Dashboards for Multiple Locations
Businesses with multiple offices, stores, warehouses, or facilities may need different dashboards in different locations.
For example:
Headquarters
Company-wide executive dashboard.
Sales Office
Sales and pipeline metrics.
Warehouse
Orders and fulfillment metrics.
Customer Support Center
Support performance.
Manufacturing Facility
Production and safety KPIs.
Digital signage software can organize screens into groups so each location receives appropriate content.
Why Choose Buzzblender for Business Dashboard Digital Signage?
Buzzblender provides a simple cloud-based platform for managing compatible workplace digital signage.
Only $5 Per Screen Per Month
Buzzblender costs just $5 per screen per month, making it affordable to put business information on more screens throughout an organization.
Cloud-Based Management
Manage dashboard displays from a centralized platform.
Web Content
Compatible web-based content can be incorporated into digital signage deployments, making it possible to use screens for dashboards alongside traditional signage content.
Content Scheduling
Schedule dashboard content according to:
- Time
- Date
- Department
- Location
- Screen
Combine Dashboards with Other Content
A screen does not need to display a dashboard continuously.
A playlist might rotate between:
- Sales dashboard
- Company announcements
- Employee recognition
- Upcoming events
- Safety information
Multi-Screen Management
Manage one dashboard display or a larger network of screens.
Multi-Location Management
Organize displays across offices, warehouses, stores, production facilities, and other locations.
Broad Device Compatibility
Buzzblender can support compatible deployments using:
- Android
- Windows
- LG webOS
- Samsung Tizen
- Commercial displays
- Media players
Take control of your screens today with Buzzblender
Dashboard Digital Signage vs Desktop Dashboards
Digital Signage Dashboard
Best for:
- Shared KPIs
- Team goals
- High-level metrics
- Operational awareness
- At-a-glance information
Desktop Dashboard
Best for:
- Detailed analysis
- Interactive filtering
- Individual investigation
- Complex reports
- Sensitive information
Organizations can use both.
Digital signage communicates the metrics everyone should know, while desktop dashboards provide deeper analytical capabilities.
Dashboard Digital Signage vs Static Reports
Digital Dashboard
Can provide:
- Automatically changing data
- Dynamic charts
- Current KPIs
- Centralized screen management
Static Report
Usually provides:
- A snapshot at a specific time
- Manual updates
- More detailed analysis
- Printable information
For operational metrics that change frequently, a dashboard can provide greater visibility than periodically distributed static reports.
Designing Dashboards for Digital Signage
A dashboard designed for a laptop is not automatically a good dashboard for a wall-mounted screen.
Use Large Numbers
Important KPIs should be readable from the expected viewing distance.
Limit the Number of Metrics
Focus on the information employees actually need.
Use Clear Visual Hierarchy
The most important metric should receive the greatest visual emphasis.
Avoid Tiny Tables
Detailed spreadsheets are difficult to read on wall-mounted displays.
Use Simple Charts
Charts should communicate their meaning quickly.
Consider Viewing Time
Employees may look at the screen for only a few seconds.
Security Considerations
Business dashboards can contain sensitive information.
Before displaying a dashboard, consider:
- Who can see the screen?
- Does it contain customer information?
- Does it contain employee information?
- Are financial metrics confidential?
- Can visitors see the display?
- Does the dashboard reveal credentials or private URLs?
Public-facing and visitor-accessible displays should only show information approved for those audiences.
Best Practices
- Display only actionable KPIs.
- Keep dashboard layouts simple.
- Use large typography.
- Choose metrics appropriate for each team.
- Avoid confidential information on public screens.
- Group screens by department and location.
- Refresh data at an appropriate interval.
- Combine dashboards with other internal communications when useful.
- Review KPIs regularly.
- Remove obsolete dashboards.
Common Mistakes
Too Many Metrics
Trying to display an entire analytics platform on one screen makes information difficult to understand.
Small Text
Dashboards should be designed for the actual viewing distance.
Displaying Confidential Data
Consider the physical audience before publishing business information.
No Context
A number such as “73” means little unless employees understand what it represents and whether it is good or bad.
Showing Outdated Data
Clearly communicate when the data was last updated if freshness is important.
Using Screens Only for Dashboards
In many workplaces, combining dashboards with announcements and employee communications makes better use of available screens.
We Support Different Operating Systems


Frequently Asked Questions
What is digital signage for business dashboards?
It is the use of digital signage screens to display business dashboards, KPIs, sales results, operational metrics, and other company data in shared workplace environments.
Can digital signage display real-time dashboards?
Yes, when the underlying dashboard and signage implementation support automatic data refreshing.
What KPIs can I display?
Sales, marketing, operations, customer service, manufacturing, logistics, financial, and other relevant business KPIs can be displayed.
Can different departments see different dashboards?
Yes. Screens can be grouped so sales, operations, support, manufacturing, and other departments receive different content.
Can dashboards and regular digital signage share the same screen?
Yes. A playlist can rotate between dashboards, announcements, employee recognition, events, and other content.
Can I display a dashboard on an office TV?
Yes. A compatible TV or commercial display can be used as a business dashboard screen with an appropriate signage player or supported smart signage platform.
Is it safe to display business dashboards?
Yes, provided the dashboard contains information appropriate for everyone who can physically see the screen and the deployment follows appropriate security practices.
How much does Buzzblender cost?
Buzzblender costs just $5 per screen per month.
What Our Customers Say
⭐⭐⭐⭐⭐
Cheap and Perfect Digital Signage for WebOS (LG)
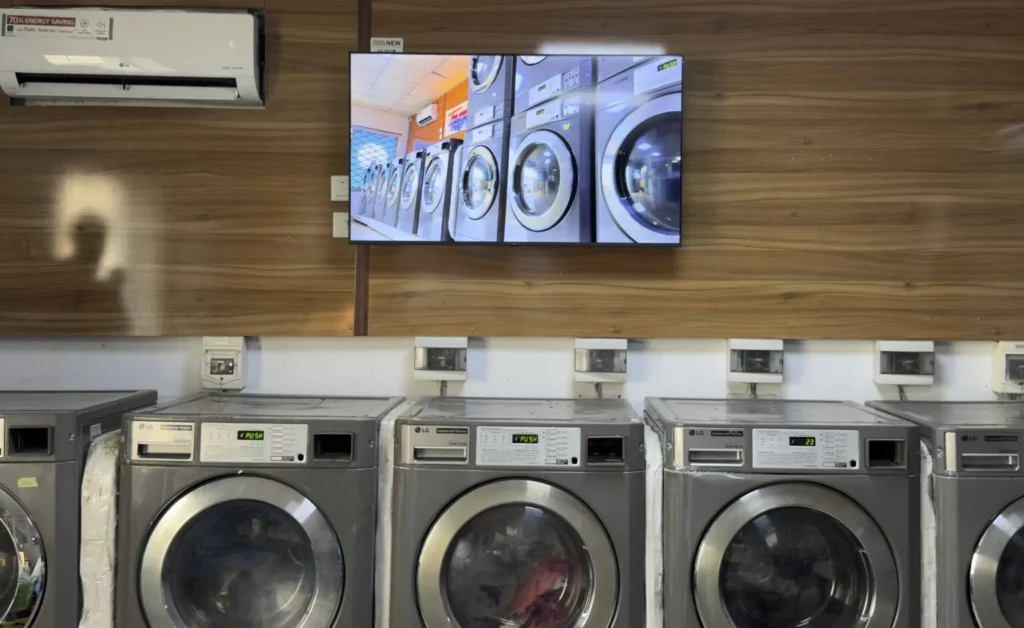
My experience with Buzzblender has exceeded expectations. It simplifies content management. We use LG (WebOs) and Buzzblender works perfectly on our screen
Agbanike, True Wash Laundromat